Understanding Covid Numbers
10 May 2021 11:56:59
I have lost two close family members to Covid, both my parents were hospitalized for over a week in April 2021, my son had Covid in October 2020, and more than 65 others in my family and close friends have had it at some time or the other, so I too am affected by this once-in-a-century pandemic. But I am a realistic person who studies facts and data before reaching conclusions.
Ever since 6 April 2021, when India’s Covid-19 cases crossed one lakh (100,000) for the first time since the pandemic started in India in Feb 2020, people started blaming Prime Minister Narendra Modi for India’s ‘second wave’. When the daily case count crossed 1.5 lakh cases just four days later, the voices became a little louder. These were not just voices on TV screens, but also posts on social media (especially Twitter), and articles in Indian and foreign newspapers and news websites.
Fast forward to just five days later and the anti-Modi voices gained additional momentum, as India crossed the unfortunate milestone of two lakh cases in a day. Yes, India doubled its daily case count in just nine days in the first half of April. The daily case count had peaked at below a lakh (97,859) during the ‘first wave’, on 16 September 2020. Of course, the second wave was much worse. India crossed three lakh cases on 21 April 2021, the cases on that day being 2.74 times the number recorded just 15 days earlier. By that time, India already had severe shortages of hospital beds, oxygen, and Remdesivir.The anti-Modi brigade now got a huge supply of additional arsenal to aim at India’s prime minister (PM). The same PM who had won a larger mandate from India’s 613.137 million voters less than two years earlier, who had been credited across the world just one year earlier for handling the pandemic very well, and who had been applauded just a couple of months earlier by more than 50 world leaders for helping them combat the disease in their own countries, as India had exported (or even donated) vaccines to more than 90 countries.
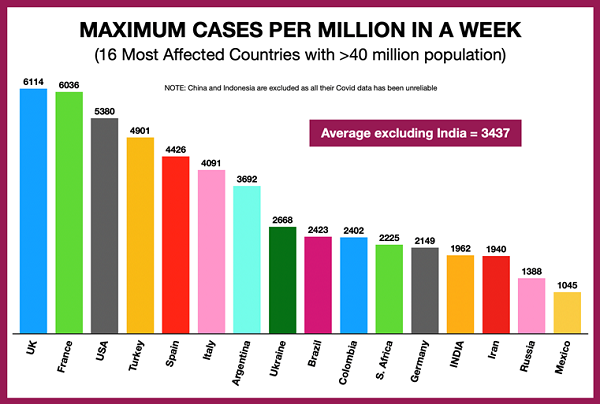
The attack did not come from China or Pakistan. It came from within—from political opponents of Modi and the BJP and their voters, from journalists and media houses that have always been against Modi/BJP, from hundreds of armchair ‘experts’ who took on Modi and the BJP on TV debates and thousands more through social media, especially Twitter. Let’s look at some numbers. Yes, India reported 414,182 cases on 6th May, and crossed 400,000 (four lakh) cases on three out of seven days during the week. But how do India’s Covid-19 cases in this difficult period compare with other relatively large countries which have reported a very high number of cases in any given week?
The comparison has to be in terms of the number of cases per million (one million = 10 lakhs) population, as there is no other way to compare data, since you can’t expect cases in a huge country like India to be the same as Italy with 4.34% of India’s population, Brazil with 15.37%, or even the USA with 23.9% of India’s population. The daily circulation of The Times of India is more than double of the UK’s largest newspaper Metro and almost 1.78 times higher than USA Today not because more Indians read English newspapers, but because India has so many more people. Indian Railways has 10.1 times more passenger-kilometres of traffic than Russian Railways as India’s population is 9.53 times higher than Russia’s. Therefore, it is but natural that India will see many more people get sick from a pandemic than much smaller countries.
If China disclosed Covid-19 data honestly, we would have some ‘real’ comparisons, but China hasn’t done so—not that anyone with even an average IQ expects them to. As you can see from the chart, despite India reporting more than 2.73 million (27.3 lakh) cases from 30 April to 6 May (including both days), we were much lower than seven of 15 other countries with minimum population of 40 million (four crores) and comfortably lower than three others. In fact, the average for the 15 countries excluding India is 491 compared to India’s 280.3.
The logic for using countries with minimum 40 million people is simple. There are only 14 countries with over 100 million people, and eight (China, Indonesia, Pakistan, Nigeria, Bangladesh, Japan, Ethiopia, and Egypt) are under-reporting numbers, mismanaging Covid, or have miraculous immunity from the disease. That leaves six, which is too small a sample. If I pick another 15 countries with over 50 million people, seven have the same issues. By picking countries with minimum 40 million people, I could get 15 countries to compare with.
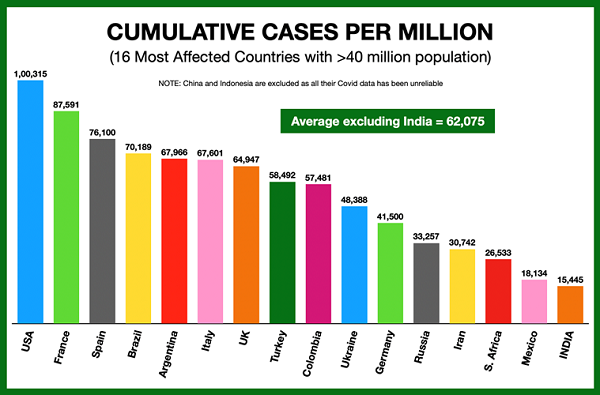
Even if India’s actual case (and death) count is larger than ‘official’ figures, how do we know the same is not the case with other countries? Going by the nature of governments in Turkey, Ukraine, Colombia, Iran, and Russia, it is very likely they have fudged data. How does India compare with other countries in cumulative cases? In this chart, all the 15 other countries have higher cumulative cases than India as on 6 May 2021. And the differences with India (except in the case of Mexico) are huge. India’s number is just 24.9% of the average.
It is also very important to look at the case count in the context of tests done. The fewer the number of tests, the fewer will be the number of cases (for any disease), and vice-versa. The numbers (as on 4 May) for total tests done per 100 million people in 20 large countries with a minimum population of 50 million (five crore) people are given in the next chart. If you multiply by 100, you get the number of tests done per million people. While India has fared much better in its testing numbers than far richer countries such as Japan, South Korea, Iran, Mexico, Thailand, South Africa, and Indonesia, we could have still done better, as I said in over 200 blog posts that I wrote on the Covid-19 pandemic between March and November 2020, which you can easily find at www.bagariaamit.com.
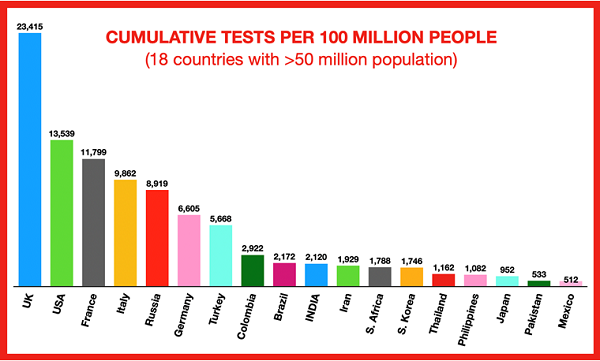
As on 4 May, the world (excluding China) had conducted a total of ~2.053 billion (~205.28 crore) tests, and India’s share was 14.37% compared to its population share of 21.67% (excluding China). India’s testing share is thus 66.31% of its population share, and if we had conducted 1.5 times the number of tests, we would have been at par with our population share. Anyways, the 2120 number is not that bad, considering that India (per capita GDP of $2191 as per IMF’s April 2021 World Economic Outlook Database) is not as rich as the UK, the USA, France, Italy, Russia, Germany, Turkey, Colombia, and Brazil. The fact that we did more testing than seven countries with higher per capita income based on purchasing power parity (Iran, South Africa, South Korea, Thailand, Japan, Indonesia, and Mexico, is a feat in itself, It is also quite important to study the data pertaining to the TPR (Test Positivity Rate is the number of people tested positive as a percentage of total tests done) in different countries and regions around the world. The TPR for 20 countries is given here. I have included Japan, Indonesia, the Philippines, Thailand, Pakistan, and Bangladesh to give a comparison with other large Asian countries including India’s neighbours.
The average TPR for 209 countries excluding China is not much different from the average of these 20 countries. India’s TPR of 7% is below the world average. Though it was ~8% and had peaked at 15.7% during the first wave, it plateaued to ~2% between December 2020 and February 2021, but has made a huge jump to average ~17.16% between 5 April and 4 May 2021, with a peak of 25.3% on 25 April. This could not have been anticipated by anyone, as less than 10% of all countries have experienced such an increase in TPR between their peaks.
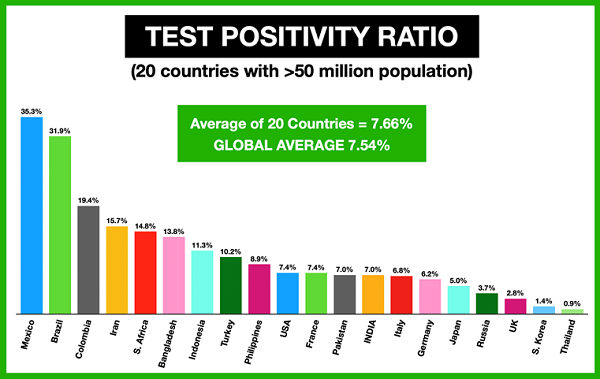
Contrary to #FakeNews and rumours, it can be safely assumed that India has not fudged its TPR, meaning that government labs have not converted positive test results into negative due to pressure from ruling parties in different states. If states had done this, the ‘news’ could have easily been leaked by people who work at these labs. I think there were some such reports from West Bengal, but I have not verified the same. Let us look at two more comparisons. The first is the Deaths per Million as on 6 May 2021.
Yes, the number of Covid-related deaths in India is low, at only 26.66% of the average of these 19 countries. There could be two explanations. The first is that India has a much younger population compared to Western countries.
India’s median age is 28.7 years, compared with Italy’s 46.5, the UK’s 40.6, the USA’s 38.5, France’s 41.7, Germany’s 47.8, and Russia’s 40.3. Indonesia at a median age of 31.1, and the Philippines as well as Egypt both at 24.1, have a similar death rate as India. The only outliers are the Latin American countries Brazil (33.2 years), Mexico (29.3), and Colombia (31.2); and South Africa (28); but these two continents are the worst affected by Covid-19. Japan (48.6 years) may have such low death numbers despite their very high urbanization and population density because a large percentage of the population wears face masks even in normal course, and professionals such as taxi drivers, bus drivers, porters, etc. also wear gloves. The less said about Pakistan and Bangladesh, the better.
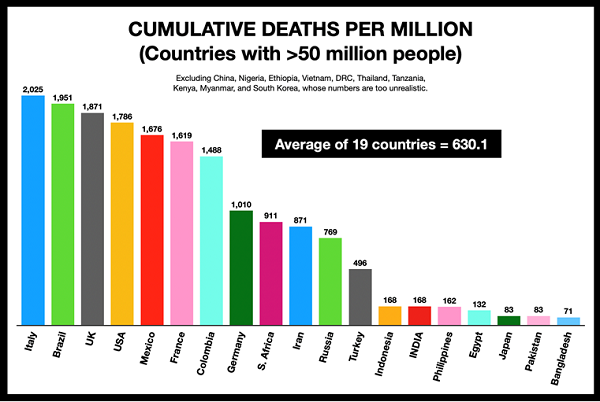
The second reason could be that deaths have been under-reported, and this could be either because the governments (Central and states) want to suppress the numbers, or sheer mismanagement. Even if the actual deaths are double the ‘official’ figures, we would be at 53.32% of the average, without factoring the very real possibility that deaths have been under-reported by Iran, Turkey, Indonesia, the Philippines, Egypt, Pakistan, and Bangladesh.
Let us look at the Case Fatality Rate (CFR), or the percentage of cases which have resulted in deaths. This is more important than the death rate, as the death rate without factoring cases means very little. If we exclude Mexico (a
huge outlier), the average of the balance 17 countries falls to 1.96%.
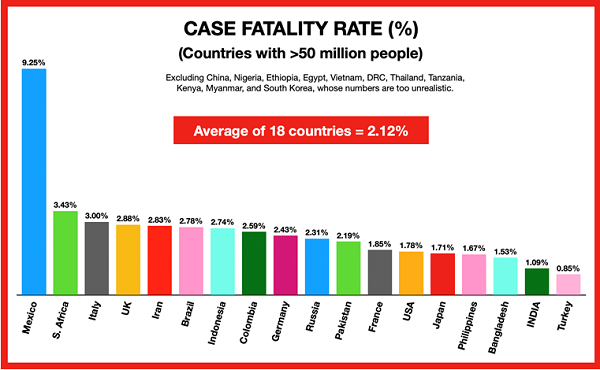
Even then, India’s 1.09% is low, despite our lower median age. We can safely conclude that death rates in India are being under-reported. If we assume that actual deaths are double the official figures, India’s CFR goes up to 2.18%, which is very believable, considering that our health infrastructure is not as good as most of the other countries in the above chart. Propaganda articles (especially in foreign media) and tweets have suggested death tolls of 3x, 5x, and even 10x the official figures.
Even 3x can be true, but 5x puts the CFR at 5.45% and such a high CFR cannot be believed by any logic. As far as 10x is concerned, are people suggesting that India has lost 2.341 million (23.41 lakh) lives to Covid-19, and has a CFR of 5.14 times the average of these 18 countries? Officially, 59,736 people died due to Covid from 15 April to 6 May 2021. Are these morons trying to convince us that 537,624 bodies were secretly cremated or buried? Over five lakh bodies?? Be realistic!!! Criticize the government for its mistakes, but STOP playing games with death, as what goes around, comes around.
.
.